
Your Paint Consistency Test Might Be Lying to You
Paint consistency charts (the gauge sheets where you let paint run down the paper and read where it stops) are a great tool. But they’re less exact than they look. Two people can test the same paint, thinned the same way, and get different readings. If you’ve ever compared your result to someone’s on YouTube and thought “why is mine so different?”, this is probably why.
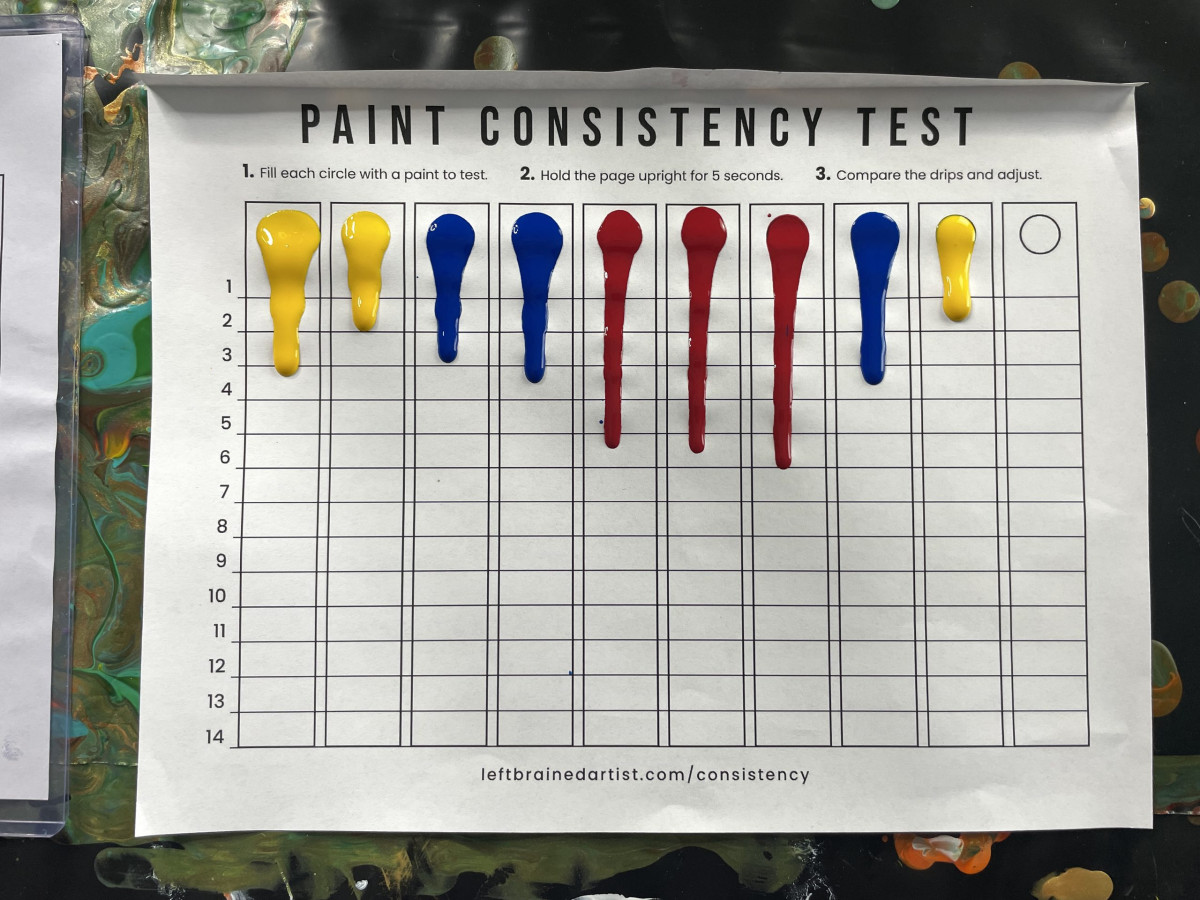
The Surface Changes Everything
Not everyone’s chart surface is the same:
- Bare paper absorbs some of the paint, which slows it down.
- Plastic sleeve is slick, so paint runs further and faster.
- Taped-over chart (to reuse it) behaves like a sleeve, but the tape’s texture and edges can change the flow.
- Printed or photocopied charts use different paper weights and finishes, and a copy may not even be printed at the original scale.
Same paint, different surface, different reading.
Technique Adds More Variation
Small differences in how the test is done add up:
- Tilt angle. Some people tilt to 90°, some to 45°, and “about 45°” by hand is rarely exactly 45°.
- Run time. Letting it run 5 seconds vs. 10 seconds gives a very different result. Also, counting in your head isn’t precise. My counting is always too fast compared to the clock.
- Amount of paint. A bigger drop runs farther than a small one.
None of these are wrong. They just aren’t the same, and that means no test is ever 100% accurate.
How to Use the Chart the Right Way
- Compare within your own batch. The chart is most useful for comparing paints to each other in the session you’re testing, not as an absolute number.
- Test the same way every time. Pick one surface, one angle, one run time, and one amount of paint, and stick with them. Use a timer instead of counting.
- Write down your setup. Note the surface, angle, and time alongside each result. Refer back every time you test.
- Take other people’s results as a rough guide. When you compare against someone else’s test, including mine, check how they tested before you trust the number.
My Test Setup
So you can compare fairly, here’s how I test:
- Chart: LBA Paint Consistency Test sheet
- Surface: (https://link.amazon/B0aznfi9Q) so I can reuse for years
- Amount: Fill the circle
- Angle: 90° – straight up and down
- Drip time: 10 seconds, timed
My Consistency Results
I’ll keep adding to this table as I test more techniques. Ratings are my overall score for how fast the paint dripped at that consistency (1–14).
Have a question or a paint you want me to test? Leave a comment below.